CASE 01 · PRESS GANEY

The same numbers, rebuilt for the people reading them.

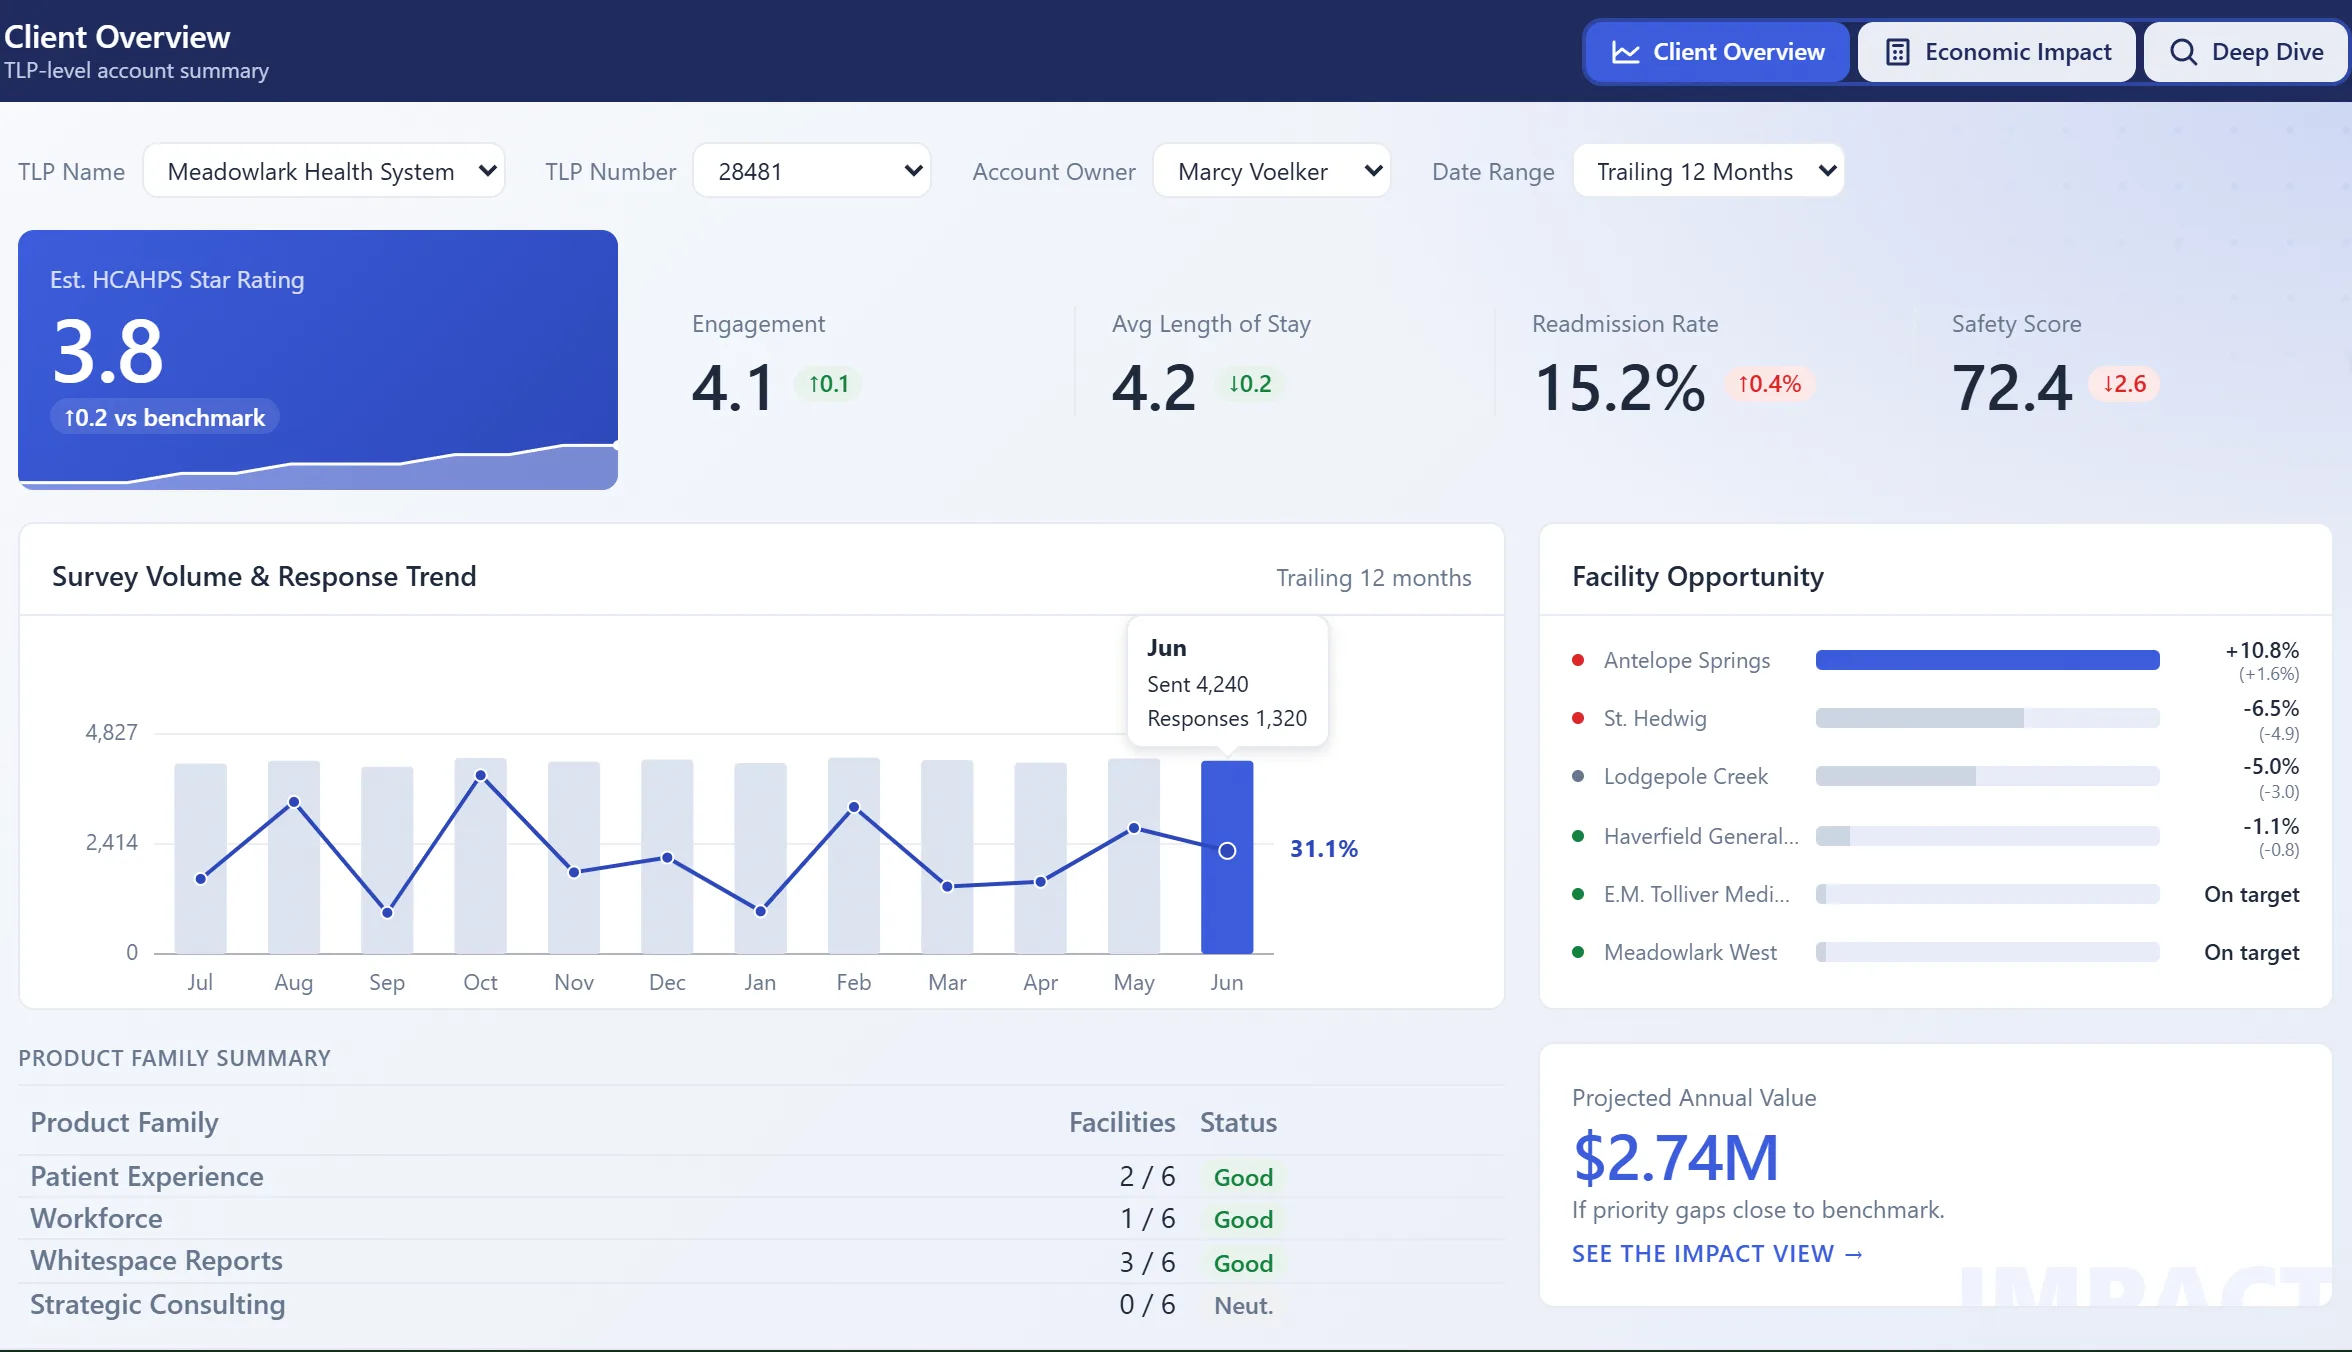
A client-profile dashboard with every number on it and nothing to act on. I sat with the sales team, found what each reader actually needed, and rebuilt it in Power BI.
(TL;DR)

SITUATION
A sales team had a client-profile dashboard with every number on it and nothing to act on, and readers said some of the high-level data was not what they needed.
WHAT I DID
I sat with the sales team, wrote down what each reader needed, and found what upgrades they wanted.
RESULT
Three views, one set of requirements, built inside Power BI limits: actionable insight and calculators in place of numbers nobody asked for.

The ask

I sat with the sales team and wrote down what each reader needed. They get about four minutes with a client, and the page in front of them had no trend and no benchmark on it.

Same data, different readers

One page was being read for different jobs. An account lead opening a call needs movement against a benchmark; the chart on this page plots survey volume, which answers a different question.

The build

The design was mine and the build was the team’s, with my manager partnering on the data. Every choice had to be one Power BI could actually ship, so the requirements were written against the tool, not around it.

What changed

Readers said openly that some of the high-level data was not what they needed. The rebuild traded it for things they could act on: benchmarks, deep dives, and calculators that help close a deal.

BEFORE: the dashboard as it stood. Not my work.

Est. HCAHPS Star Rating3.8
Engagement4.1
Avg Length of Stay4.2
Readmission Rate15.2%
Safety Score72.4
VBP Score58.0

Series: Surveys sent, Responses received

05001,0001,5002,0002,5003,0003,5004,0004,5005,000JulAugSepOctNovDecJanFebMarAprMayJunSurveys sentResponses received
33%33%33%
  • Trending better (2)
  • Stable (2)
  • Trending worse (2)
Facility Performance
FacilityEst. StarReadmissionSafetyTrend
E.M. Tolliver Medical Center4.113.8%79.0Good
Haverfield General Hospital3.914.7%74.2Neutral
St. Hedwig3.615.9%70.1Bad
Antelope Springs3.516.4%68.4Bad
Meadowlark West4.014.2%76.3Good
Lodgepole Creek3.715.1%71.5Neutral
Product Families
Product FamilyFacilitiesOwnedCandidateApproached
Patient Experience2 / 6YesNoYes
Workforce1 / 6YesNoNo
Whitespace Reports3 / 6YesNoYes
Strategic Consulting0 / 6NoYesYes

BUILT IN POWER BI

ILLUSTRATIVE VALUES · structure and requirements real, client data synthetic